
If you’re looking to enhance your Next.js project with beautiful charts and design, the Chart.js library is a great choice. In this blog, we will explore how to integrate Chart.js into your Next.js project. Let’s get started!
Step 1: Create a Next.js project
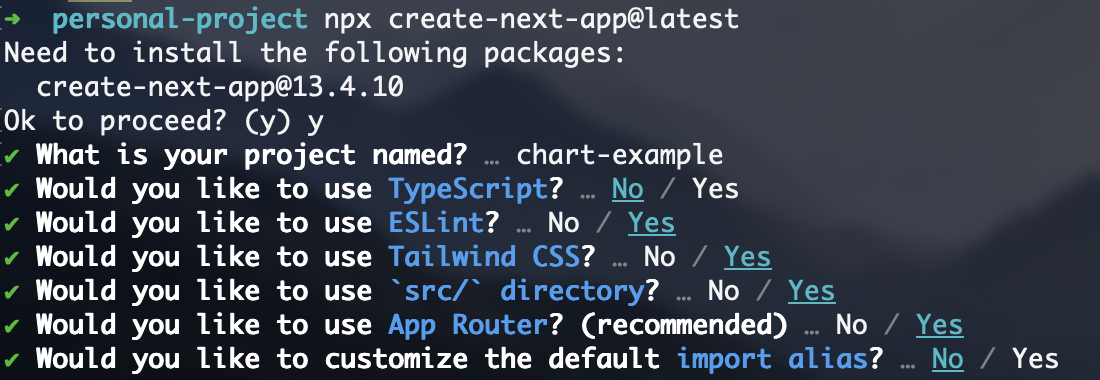
To create a Next.js project, use the following command:
1
npx create-next-app@latest
During the project creation process, you will be prompted to provide a project name and configure other settings. Here’s an example of a configuration:
Step 2: Import necessary packages
To use Chart.js in your Next.js project, install the required packages:
1
yarn add react-chartjs-2 chart.js
After adding the dependencies, you can import and use them as follows:
Code
1
2
3
4
5
6
7
8
9
10
11
12
13
14
15
16
17
18
19
20
21
22
23
24
25
26
import { Doughnut } from "react-chartjs-2";
import { Chart, ArcElement, CategoryScale, Tooltip, LinearScale } from 'chart.js'
Chart.register(ArcElement, CategoryScale, LinearScale, Tooltip);

const DoughnutChart = () => {
  const data = {
    labels: [
      'Red',
      'Blue',
      'Yellow'
    ],
    datasets: [{
      label: 'My First Dataset',
      data: [300, 50, 100],
      backgroundColor: [
        'rgb(255, 99, 132)',
        'rgb(54, 162, 235)',
        'rgb(255, 205, 86)'
      ],
      hoverOffset: 4
    }]
  };
  return <Doughnut data={data} />;
}

export default DoughnutChart;
The important part here is the Chart.register() function. Without registering the necessary elements, you might encounter an error stating Error: "arc" is not a registered element.
I’ve implemented a basic demo of the above code. You can check the live DEMO here.
Conclusion
In conclusion, by integrating Chart.js into your Next.js project, you can easily incorporate visually appealing and interactive charts. With the steps outlined in this blog, you can quickly set up and utilize Chart.js in your project. Start leveraging the power of charts to enhance data visualization and deliver valuable insights to your users. Get creative with different chart types, customize them to suit your needs, and make your Next.js project more engaging and informative. Chart.js offers a versatile and user-friendly solution for incorporating charts into your web applications. So, start charting your way to better data representation today! 📊📈